Debugging Tools for javascript libraries
We know that, there are so many javascript libraries developed and customized for web developers and it give to us better UI result. Nowadays elements custom attribute played major role in js library with enrich application like knockoutjs,angularjs and so on. Enhance single page application with ajax techniques also.
chrome browser extensions helps to deal with javascript libarary debugging tools. Most of the famous javascript library team created its own debugging devtools.
For example,
Jquery debugging tool element panel when we select anyone of the element in the inspect page right side panel give more information about that element(Event Details, animation function details…..)
Jquery panel selector handling activities measure in that panel.
Following some details about popular javascript library and debugging tool features:
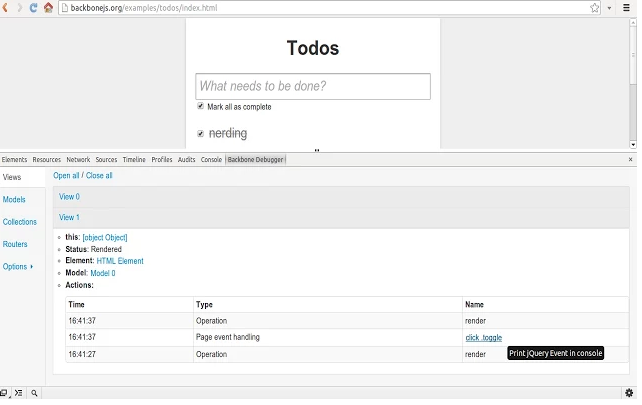
Adds a panel under the Chrome Developer Tools that displays in real-time all your application views, models, collections and routers. Data displayed includes:
– Views: rendering status, html element, associated model and/or collection, handled page events, events triggered
– Models: last sync status, attributes, id, cid, url, associated collection, events triggered, sync actions
– Collections: last sync status, models, url, events triggered, sync actions
– Routers: events triggered (include routes)
Extends the sidebar of the developer tools “Elements” panel to display the Backbone View of the inspected html element.
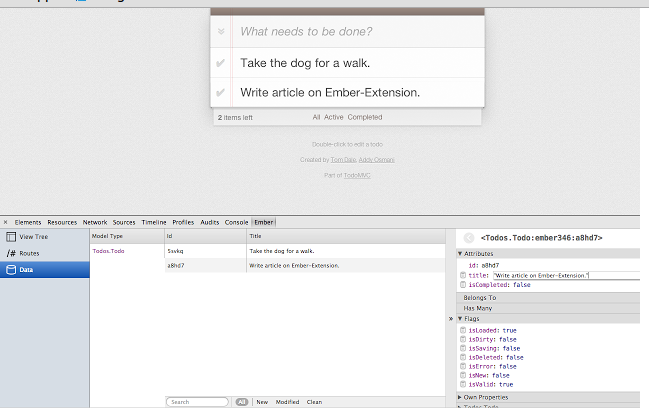
– View all of the routes defined in your application.
– Reference Ember’s naming conventions for your URLs, including what to name your controllers, templates, routes and more.
– Overlay your application with information about what templates, controllers, and models are currently being rendered.
– Inspect the objects in your application, such as models and controllers, with UI that fully supports Ember features such as bindings and computed properties.
– Make your application’s objects available in the console as the $E variable.
– If you’re using Ember Data, see all of the records that have been loaded.
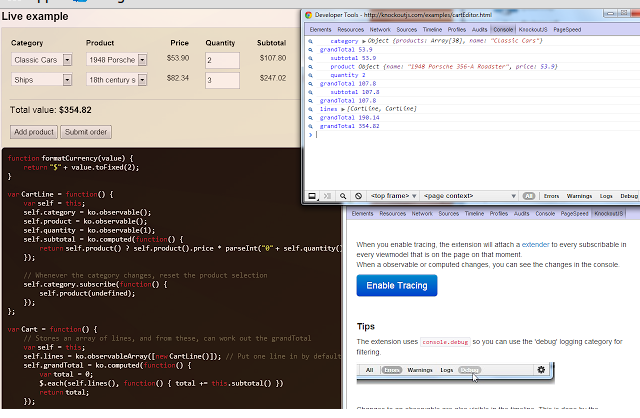
Adds a extra sidebar in the elements pane of the chrome dev tools with the relevant knockout context and data for the selected element.
Very usefull if you got large/nested view models.
Allows to add tracing to every observable/computed.
Allows to edit observables from the console.
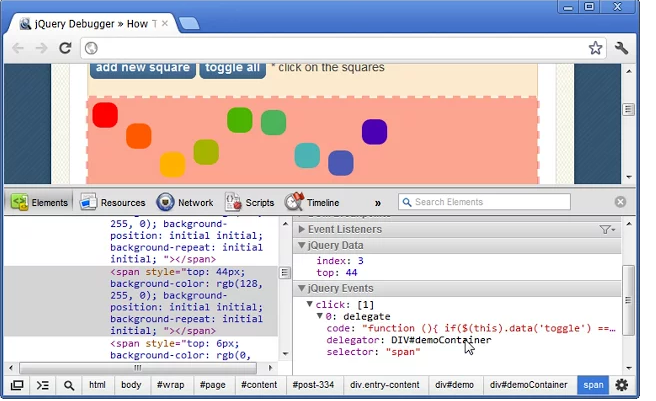
– New Selector Inspector panel
– Comfortably inspect your jQuery selectors, and watch their matching elements displayed on any website.
– Designed to help you understand easily even the most complex selectors.
Two new sidebars on the Elements panel
– jQuery Data sidebar – shows the jQuery and HTML5 data of the selected element.
– jQuery Events sidebar – shows the event handlers of the selected element, including events that are live or delegated on other elements which have an affect on the selected element.
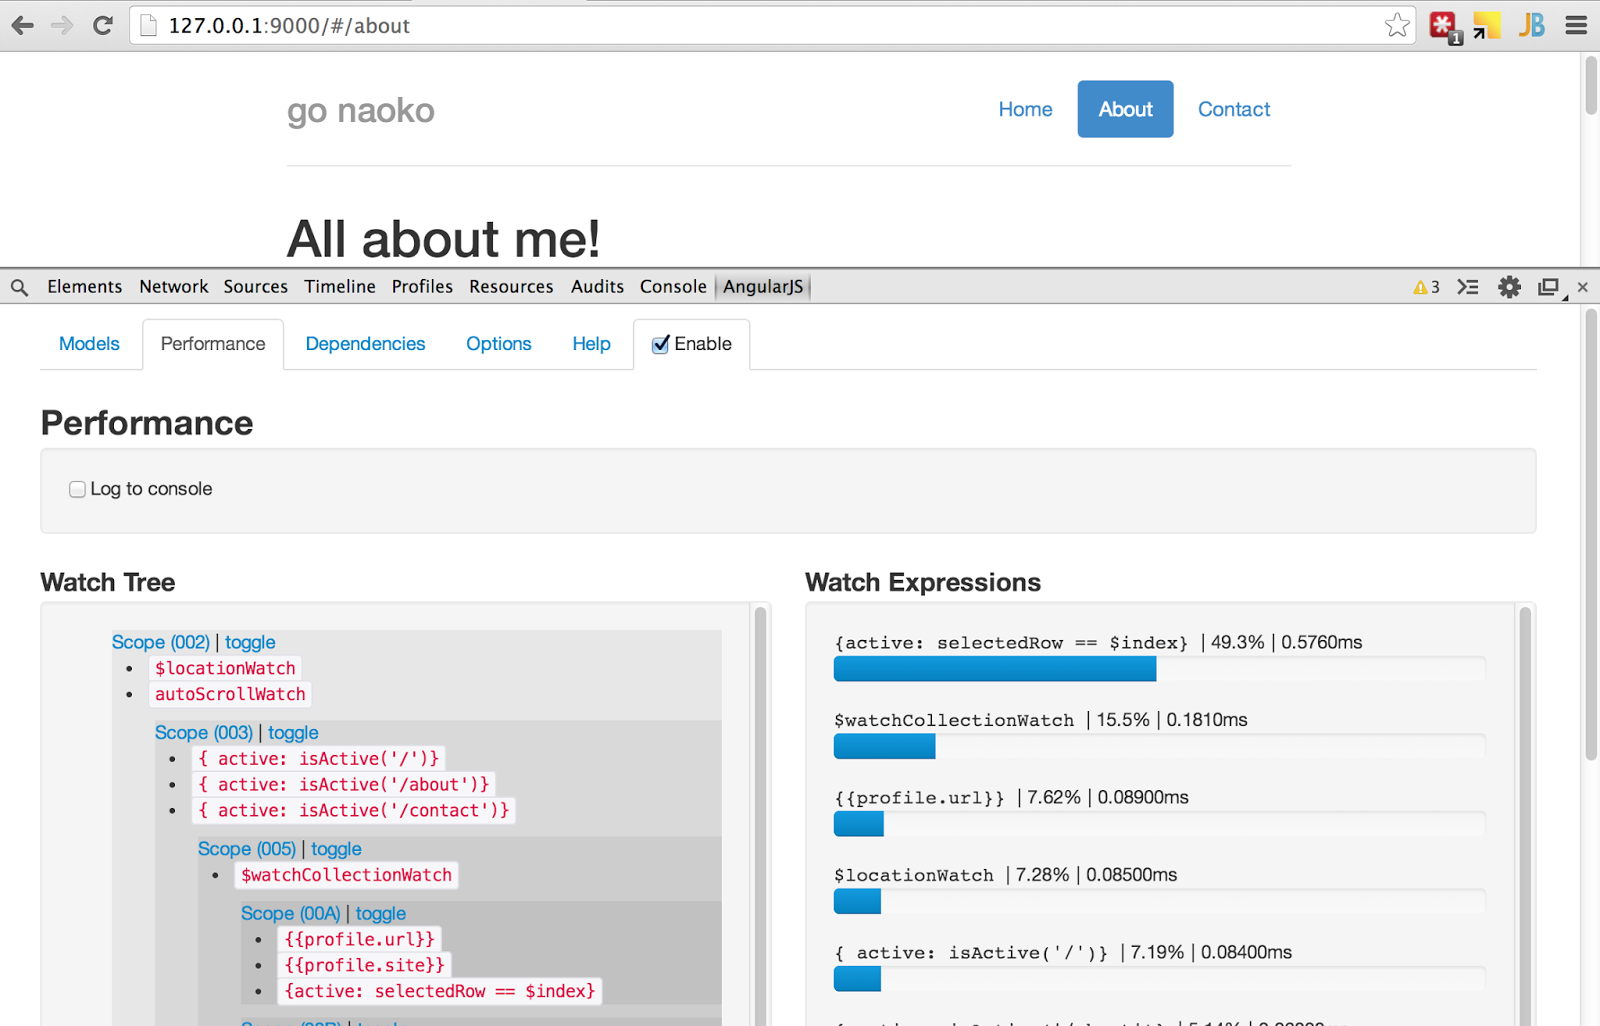
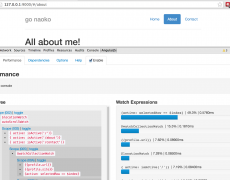
The Batarang has five tabs: Model, Performance, Dependencies, Options, and Help.
Models
Starting at the top of this tab, there is the root selection. If the application has only one ng-app declaration (as most applications do) then you will not see the option to change roots.
Below that is a tree showing how scopes are nested, and which models are attached to them. Clicking on a scope name will take you to the Elements tab, and show you the DOM element associated with that scope. Models and methods attached to each scope are listed with bullet points on the tree. Just the name of methods attached to a scope are shown. Models with a simple value and complex objects are shown as JSON. You can edit either, and the changes will be reflected in the application being debugged.
Performance
The performance tab must be enabled separately because it causes code to be injected into AngularJS to track and report performance metrics. There is also an option to output performance metrics to the console.
Below that is a tree of watched expressions, showing which expressions are attached to which scopes. Much like the model tree, you can collapse sections by clicking on “toggle” and you can inspect the element that a scope is attached to by clicking on the scope name.
Underneath that is a graph showing the relative performance of all of the application’s expressions. This graph will update as you interact with the application.
Dependencies
The dependencies tab shows a visualization of the application’s dependencies. When you hover over a service name, services that depend on the hovered service turn green, and those the hovered service depend on turn red.
Last, there is the options tab. The options tab has three checkboxes: one for “show applications,” “show scopes,” and “show bindings.” Each of these options, when enabled, highlights the respective feature of the application being debugged; scopes will have a red outline, and bindings will have a blue outline, and applications a green outline.
Elements
The Batarang also hooks into some of the existing features of the Chrome developer tools. For AngularJS applications, there is now a properties pane on in the Elements tab. Much like the model tree in the AngularJS tab, you can use this to inspect the models attached to a given element’s scope.
Console
The Batarang exposes some convenient features to the Chrome developer tools console. To access the scope of an element selected in the Elements tab of the developer tools, in console, you can type $scope. If you change value of some model on $scope and want to have this change reflected in the running application, you need to call $scope.$apply() after making the change.
- Developed jump2tab extension for chrome browser users - December 22, 2014
- Debugging Tools for javascript libraries - May 28, 2014